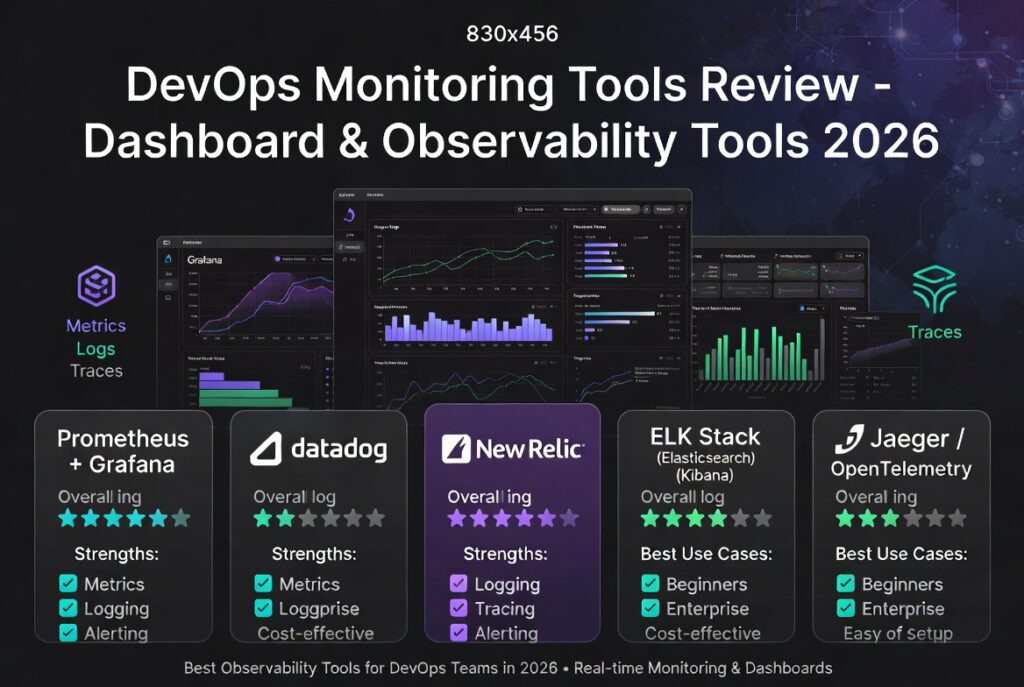
DevOps Monitoring Tools Review: Best Platforms for Observability
DevOps monitoring tools review is essential for teams that want to track system performance, logs, and application health in real time. As modern applications become more distributed and complex, monitoring tools play a critical role in ensuring reliability and uptime.
In this DevOps monitoring tools review, we explore the best platforms for observability in 2026, comparing features, pricing, and use cases so you can choose the right tool for your infrastructure.

If you’re building your DevOps stack, start with our
devops automation tools guide.
Why DevOps Monitoring Tools Matter in 2026
DevOps monitoring tools are no longer optional. With microservices, containers, and cloud-native applications, visibility into system performance is critical.
- Detect issues before users are affected
- Monitor application performance in real time
- Analyze logs and metrics efficiently
- Improve uptime and reliability
According to
Prometheus documentation, effective monitoring is key to maintaining scalable systems.
Top Monitoring Tools in This DevOps Monitoring Tools Review
This DevOps monitoring tools review focuses on the most widely used observability platforms by developers and DevOps teams.
1. Prometheus
Prometheus is an open-source monitoring system designed for reliability and scalability. It collects metrics and supports powerful querying.
- Time-series database
- Strong alerting capabilities
- Works well with Kubernetes
2. Grafana
Grafana is a visualization tool that integrates with Prometheus and other data sources to create dashboards.
- Advanced dashboards
- Multiple data source support
- Custom alerts
3. Datadog
Datadog is a cloud-based monitoring platform that provides full-stack observability, including logs, metrics, and traces.
- All-in-one monitoring
- Cloud-native integrations
- AI-powered insights
4. New Relic
New Relic offers comprehensive monitoring for applications, infrastructure, and user experience.
- Real-time analytics
- Distributed tracing
- Developer-friendly UI
5. ELK Stack (Elasticsearch, Logstash, Kibana)
The ELK stack is widely used for log management and analysis.
- Powerful log processing
- Search and analytics
- Open-source flexibility
DevOps Monitoring Tools Review: Feature Comparison
Below is a DevOps monitoring tools review based on key observability features.
1. Alerting
Alerting ensures teams are notified when something goes wrong.
- Prometheus: Powerful alert manager
- Datadog: Smart alerts with AI
- New Relic: Real-time notifications
2. Metrics Collection
Metrics provide insight into system performance.
- Prometheus: Best for metrics
- Datadog: Full-stack metrics
- Grafana: Visualization-focused
3. Log Management
Logs help debug issues and track system behavior.
- ELK Stack: Best for logs
- Datadog: Integrated logs
- New Relic: Unified logging
4. Ease of Use
- Grafana: Easy dashboards
- Datadog: User-friendly UI
- Prometheus: More technical setup
5. Pricing
- Prometheus: Free (open-source)
- Grafana: Free + paid cloud
- Datadog: Paid (usage-based)
- New Relic: Free tier + paid
Pros and Cons of DevOps Monitoring Tools
Pros
- Improved system reliability
- Real-time performance insights
- Better debugging and troubleshooting
Cons
- Setup complexity for some tools
- Cost for enterprise solutions
- Learning curve for beginners
Best Use Cases for DevOps Monitoring Tools
This DevOps monitoring tools review shows that different tools fit different use cases.
- Startups: Prometheus + Grafana
- Enterprise: Datadog or New Relic
- Log-heavy apps: ELK Stack
Stay updated with trends in
Tech News.
How to Choose the Right Monitoring Tool
Choosing the right tool depends on your infrastructure and team needs.
- Cloud vs on-premise setup
- Budget and pricing model
- Ease of integration
- Scalability requirements
Teams should also consider how well the monitoring tool integrates with CI/CD pipelines and infrastructure tools.
🚀 Download DevOps Monitoring Checklist
Want to set up monitoring the right way? Download our free checklist and learn how to track metrics, logs, and alerts like a pro.
Future Trends in DevOps Monitoring
DevOps monitoring tools are evolving rapidly with new technologies.
- AI-driven anomaly detection
- Unified observability platforms
- Automated incident response
These advancements will make monitoring smarter and more proactive.
Conclusion
This DevOps monitoring tools review highlights the importance of observability in modern software systems. Tools like Prometheus, Grafana, Datadog, and New Relic provide powerful capabilities for tracking system health and performance.
Choosing the right tool depends on your use case, budget, and technical expertise. By implementing proper monitoring, teams can improve reliability, reduce downtime, and deliver better user experiences.
FAQ
What are DevOps monitoring tools?
DevOps monitoring tools track system performance, logs, and metrics to ensure application reliability and uptime.
Which DevOps monitoring tool is best?
Prometheus and Grafana are popular open-source tools, while Datadog and New Relic offer enterprise-level monitoring.
Are monitoring tools free?
Some tools like Prometheus and Grafana are free, while others like Datadog offer paid plans with advanced features.

Leave a reply