Debugging with AI: 9 Practical Techniques for Developers in 2026
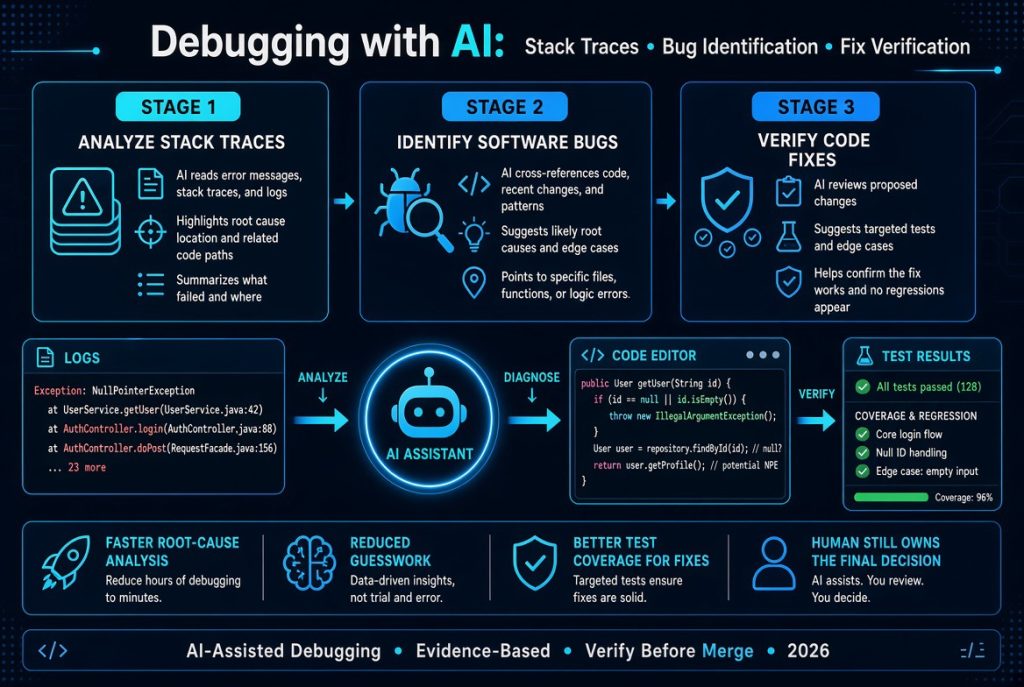
Debugging with AI is changing how developers investigate software errors, understand unfamiliar code, identify root causes, and resolve bugs. Instead of manually tracing every function and searching through documentation for hours, developers can use AI coding assistants and coding agents to interpret stack traces, analyze logs, inspect code, suggest diagnostic tests, and help implement corrections.
However, there is an important difference between an AI tool suggesting a solution and a developer proving that the solution works. AI can misunderstand application logic, overlook dependencies, make incorrect assumptions, or recommend a change that removes one error while introducing another.
The most reliable approach combines AI’s ability to analyze information with traditional debugging techniques, reproducible tests, application logs, and engineering judgement.
Quick Answer: How Does Debugging with AI Work?
Debugging with AI involves giving an AI coding assistant relevant error messages, source code, logs, and expected application behavior so it can help investigate the problem and suggest ways to resolve it.
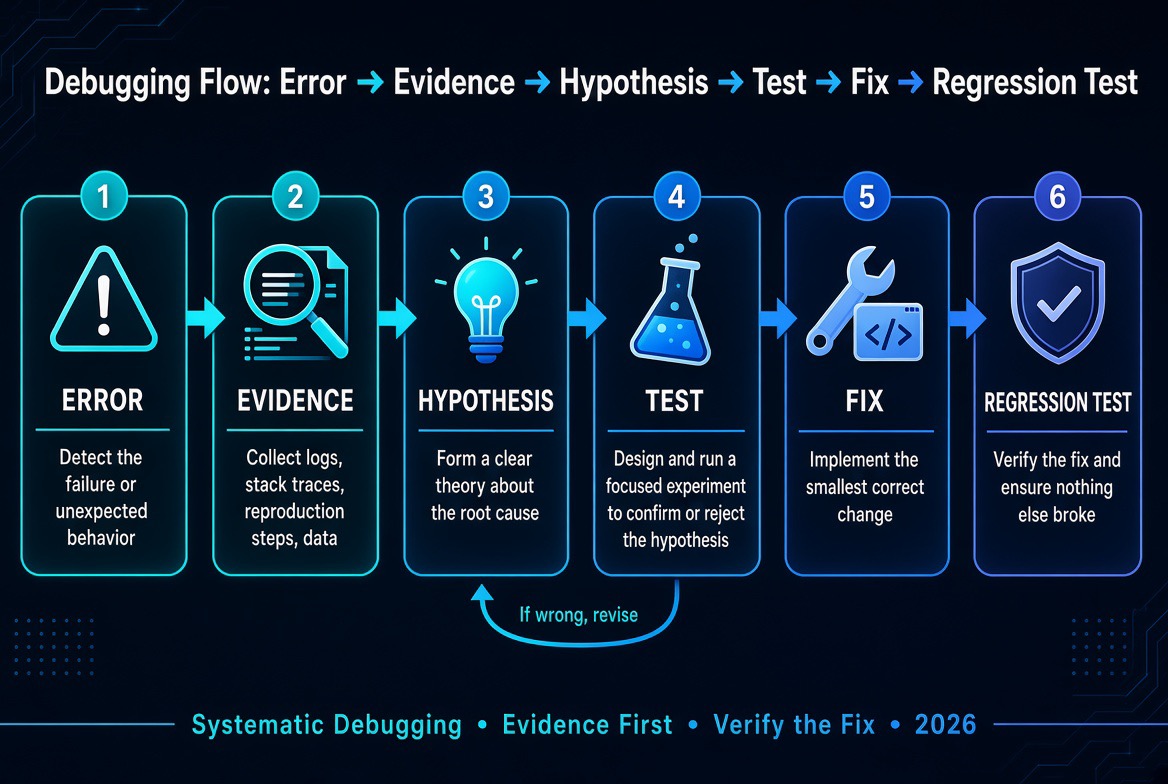
A reliable AI debugging process follows these steps:
- Reproduce the software error.
- Collect the relevant stack trace, logs, and code.
- Ask AI to investigate possible causes before editing.
- Test the leading explanation with a controlled experiment.
- Apply the smallest appropriate correction.
- Generate or update regression tests.
- Run the relevant checks and review the final changes.
Key principle: Treat AI-generated diagnoses as hypotheses, not confirmed facts. Verify every important fix with evidence.
What Is Debugging with AI?
Debugging with AI is the process of using artificial intelligence to help identify, understand, reproduce, and resolve software defects. Depending on the tool, AI can explain error messages, inspect source code, trace function calls, analyze sanitized application logs, recommend code changes, and help create automated tests.
Traditional debugging relies on techniques such as breakpoints, log statements, stack traces, test cases, database inspection, and manual code review. AI adds another layer: developers can describe a problem in natural language and ask an assistant to help connect the available evidence.
Consider a web application that returns an HTTP 500 error whenever a user submits a registration form. The problem might originate in the frontend, API handler, validation logic, database query, or an external service.
An AI assistant can help trace the request through these components and identify possible explanations. For example:
- The frontend is submitting a field with an unexpected value.
- The API expects a field that the frontend does not provide.
- The database schema does not match the application’s generated client.
- An environment variable is missing.
- An external service is returning an unexpected response.
These are possible causes, not conclusions. The developer must inspect the actual implementation, logs, and runtime behavior to determine which explanation is correct.
What AI can help developers do
- Error interpretation: Explain compiler errors, exceptions, stack traces, and failed builds.
- Code exploration: Identify relevant files, functions, dependencies, and execution paths.
- Root-cause investigation: Generate possible explanations and suggest experiments to distinguish them.
- Fix recommendations: Propose focused code changes and explain their expected effects.
- Test generation: Create unit, integration, and regression tests for known defects.
- Log analysis: Help identify patterns in sanitized application logs and error reports.
- Code review: Highlight suspicious logic, missing validation, and potential regressions.
- Documentation: Explain the cause of a defect and document the corrective action.
What AI cannot guarantee
AI cannot guarantee that its diagnosis is correct, that a suggested fix addresses the underlying cause, or that an application will behave safely in production.
Its effectiveness depends on the quality of the information provided, the model’s capabilities, the available project context, and the developer’s verification process.
Think of an AI debugging assistant as an investigative partner. It can help you decide where to look, but the actual application behavior must confirm whether you are right.
How Does AI Debugging Work?
AI debugging generally involves three connected activities: understanding the problem, investigating possible causes, and verifying a solution.
- Input collection: The developer provides an error message, relevant code, logs, expected behavior, and other useful context.
- Context analysis: The AI assistant examines the available information and identifies relevant relationships or suspicious areas.
- Hypothesis generation: It proposes possible explanations for the failure and suggests how to investigate them.
- Solution development: Once the cause is supported by evidence, the assistant can suggest a correction or help implement it.
- Verification: The developer runs tests, builds the application, and checks whether the original failure has been resolved without creating new problems.
Some AI tools operate only as conversational assistants. Others can inspect a repository, edit files, execute approved commands, and work through multi-step development tasks. The amount of autonomy depends on the product and the permissions granted.
This distinction matters. A tool that explains an error is not necessarily capable of reproducing it, and an agent that modifies code is not necessarily capable of verifying every consequence of that modification.
Why Developers Use AI for Debugging in 2026
Modern applications rarely operate as isolated pieces of software. A typical application may contain frontend components, APIs, background workers, databases, authentication services, external integrations, and cloud infrastructure.
A visible error in one component may be caused by a problem somewhere else. AI can help developers navigate these relationships and organize an investigation more efficiently.
1. Faster investigation of unfamiliar code
Understanding an existing software project can be difficult, particularly when documentation is incomplete or the original developers are unavailable.
An AI coding assistant can help explain the project structure, locate relevant functions, identify dependencies, and trace how data moves between components.
For example, a developer investigating a failed payment request might ask the assistant to identify the frontend component, API endpoint, payment service integration, and database records involved in the transaction.
This can reduce the amount of manual exploration required before debugging begins. The developer should still verify the explanation against the actual source code.
2. More productive error analysis
A stack trace often identifies where an exception occurred without explaining why the application reached that state.
AI can help interpret the trace, inspect surrounding code, identify relevant function calls, and recommend a short list of testable explanations.
Rather than changing several unrelated functions, developers can investigate the strongest hypothesis first and use the results to guide the next step.
3. Better regression testing
Fixing a bug is only part of the job. Developers also need to prevent the same problem from returning.
AI can help convert a reported defect into an automated test that reproduces the original failure and verifies the expected behavior after a correction.
This makes debugging part of the long-term software maintenance process rather than a series of isolated patches.
4. Easier collaboration and documentation
AI can help summarize technical errors in language that is easier for developers, testers, and project stakeholders to understand.
It can also help prepare incident summaries containing the observed problem, confirmed root cause, affected components, corrective action, and verification results.
This is particularly useful for teams maintaining applications with multiple developers and interconnected services.
For a broader introduction to coding assistants, read our guide to the best AI tools for developers in 2026.
9 Essential Techniques for Debugging with AI
AI debugging is most effective when developers use it as part of a structured investigation. The following nine techniques can be applied to web applications, APIs, databases, desktop software, cloud systems, and other development environments.
1. Ask AI to explain the error before changing code
Start by providing the complete, relevant error message and asking the assistant to explain what it means. Include the operation that triggered the error and the behavior you expected.
For example, imagine TypeScript reports that a property does not exist on a particular type. Instead of immediately asking AI to remove the error, ask it to explain the type mismatch and identify where the type is defined.
A useful instruction might be:
Explain this TypeScript error.
Identify:
1. What the error means.
2. Which types are involved.
3. Where the mismatch originates.
4. What the intended type relationship should be.
5. The smallest possible correction.
Do not edit the code yet. Explain the likely cause first.
[Paste the sanitized error and relevant code.]
This approach helps prevent a common mistake: changing code simply to silence an error without understanding the underlying design problem.
2. Use stack traces to narrow the investigation
A stack trace shows the sequence of function calls associated with an exception. It can provide a useful starting point for identifying where a problem surfaced and which parts of the application were involved.
Give the assistant the relevant stack trace, the code around the reported location, and a description of what triggered the error.
Ask it to distinguish between:
- The line where the error was reported.
- The function that supplied the invalid value.
- The earlier operation that may have created the invalid state.
- The evidence needed to establish the actual cause.
For example, a database exception may appear in an API handler even though the problem originated in a frontend request that supplied an unexpected identifier.
AI can help trace this sequence, but the actual call path and runtime values must support the explanation.
Security reminder: Remove access tokens, passwords, session identifiers, customer information, and other sensitive data before sharing production stack traces or logs with an AI service.
3. Ask AI to trace data through the application
Many software bugs occur because data changes format or meaning as it passes through different parts of an application.
For example, a frontend may send a numeric identifier as a string. The API may assume it is already a number, while a database query expects an integer. The application may fail because the value was not validated or converted correctly.
Ask the assistant to trace the data from its source to its destination.
For a typical web application, this investigation may include:
- Where the data is collected in the frontend.
- How the request is constructed.
- Which API endpoint receives it.
- How validation and transformation occur.
- How the database query uses the value.
- What response is returned to the client.
This technique is particularly useful when debugging API integration issues, form submissions, authentication, payment workflows, and database operations.
Ask the assistant to identify the exact files and functions involved rather than accepting a general explanation of how the application probably works.
4. Investigate one hypothesis at a time
A single application error may have several possible causes. The fastest way to investigate is not necessarily to change code immediately. It is to identify which experiment can distinguish between the leading explanations.
Suppose a reporting dashboard fails to load. Potential causes include:
- An authorization failure.
- An invalid database query.
- A missing environment variable.
- An unavailable external service.
- An unexpected response format.
Ask AI to rank these explanations based on the available evidence and recommend the smallest useful diagnostic test.
For example, checking the HTTP response status, server logs, and database response may eliminate several possibilities before any code is changed.
This is more reliable than asking AI to rewrite the entire reporting feature because it reduces unnecessary changes and makes the investigation easier to follow.
5. Use AI to create a minimal reproduction
Some bugs are difficult to investigate because they occur only under particular inputs, timing conditions, or application states.
AI can help developers construct a minimal reproduction that isolates the relevant variables and removes unrelated parts of the application.
For example, a function that processes customer records might fail only when a particular field is empty. A small test using that input can help establish whether the failure comes from validation, data transformation, or the function itself.
For intermittent problems, preserve the conditions that trigger the issue. A simplified example that removes the relevant timing, concurrency, or state conditions may fail to reproduce the actual defect.
A minimal reproduction is valuable because it turns a vague report into a repeatable technical problem.
6. Ask AI to propose the smallest safe fix
Once the evidence supports a particular root cause, ask the assistant to propose a focused correction.
Request that it explain:
- What specifically needs to change.
- Why the change addresses the confirmed problem.
- Which existing behavior must remain unchanged.
- Which edge cases should be tested.
- Whether a larger architectural issue should be addressed separately.
A small patch is generally easier to review than a broad rewrite. If the problem reveals a larger architectural weakness, separate the immediate correction from the longer-term improvement where possible.
For example, if an API endpoint fails because it does not validate a missing identifier, adding appropriate validation may be the immediate correction. Reorganizing the entire API architecture is a separate decision.
7. Generate regression tests before accepting the fix
A fix is incomplete if the same defect can easily return during a future update.
Ask AI to create a test that fails under the original behavior and passes after the correction. This is the purpose of a regression test.
For an API endpoint, useful test scenarios might include:
- A valid request with all required fields.
- A request with missing fields.
- An invalid identifier.
- An unauthorized request.
- A duplicate request where idempotency is required.
- A database failure.
- An unexpected response from an external service.
Do not simply count the number of tests generated. Check whether they actually reproduce the original defect and verify the intended behavior.
Where practical, run the regression test against the original code before applying the fix. If it does not fail under the original behavior, it may not be testing the problem you intended to solve.
8. Use AI to investigate build and dependency failures
Build failures can originate from incompatible package versions, incorrect imports, missing generated files, environment configuration, compiler settings, or changes elsewhere in the repository.
Give the assistant the exact command that failed, the relevant output, package versions, and a description of recent changes.
Ask it to:
- Identify the first meaningful error rather than focusing only on the final message.
- Determine which file or dependency is involved.
- Explain the likely relationship between the error and recent changes.
- Recommend the smallest diagnostic step.
- Propose a correction without modifying unrelated project configuration.
Avoid immediately deleting lockfiles, upgrading every dependency, or regenerating project configuration. Those actions can conceal the original cause and introduce additional problems.
For example, if a Prisma-generated client import fails after a schema update, investigate the generated client, import path, build configuration, and package versions before making broad dependency changes.
9. Ask AI to review the fix for regressions
After the correction has been implemented and the relevant tests have passed, use a separate review step to examine the changes for possible side effects.
Ask the assistant to evaluate questions such as:
- Does the change preserve existing API behavior?
- Could it introduce an authorization or data validation problem?
- Are important edge cases missing from the tests?
- Does the error handling expose internal information?
- Could the change affect another component or service?
- Does the patch introduce unnecessary complexity or dependencies?
- Are there any unrelated changes in the diff?
Inspect the actual code differences yourself. AI review can identify issues that might otherwise be overlooked, but it does not replace automated tests, security assessment, or qualified human review.
A Step-by-Step AI Debugging Workflow
The techniques above become more useful when applied through a consistent process. The following workflow can be adapted to individual development projects and larger engineering teams.
Step 1: Reproduce the failure
Before asking AI to fix anything, establish that the problem can be reproduced.
Record the actions that trigger the error, the input values involved, the environment, and the difference between expected and actual behavior.
If the error occurs intermittently, record when it happens and whether it depends on timing, user permissions, network conditions, or application state.
Step 2: Collect relevant evidence
Gather the information needed for a meaningful investigation:
- Complete error message or stack trace.
- Relevant source code.
- Recent code changes.
- Relevant application logs.
- Expected and actual behavior.
- Relevant dependency or runtime versions.
- Test results and reproduction steps.
Keep the information focused. A large amount of unrelated code can make it harder to identify the important details.
Step 3: Ask AI to investigate before editing
Ask the assistant to inspect the available evidence and identify possible causes. Require it to explain what supports each hypothesis and what information is still missing.
For a complex application, ask it to identify the relevant files and execution path before proposing a solution.
Step 4: Test the leading hypothesis
Choose a diagnostic step that can confirm or reject the proposed explanation. This may involve inspecting a runtime value, reproducing a request, adding temporary logging, running a unit test, or examining a database response.
Do not change several unrelated components at once. The objective is to establish the cause before implementing the correction.
Step 5: Implement a focused correction
Once the root cause is supported by evidence, implement the smallest appropriate change. Use version control so that the changes can be reviewed and reversed if necessary.
Step 6: Run regression checks
Run the test that reproduces the original failure, along with relevant existing tests. Depending on the project, also run:
- Unit tests.
- Integration tests.
- End-to-end tests.
- Linting and formatting checks.
- Type checking.
- Production builds.
- Relevant security and dependency checks.
Do not assume a check passed because an AI assistant says it did. Verify the actual command output.
Step 7: Review, document, and close the issue
Inspect the final diff and confirm that the correction is limited to the intended scope. Record the root cause, affected components, corrective action, and verification results.
This creates useful documentation for future maintenance and helps other developers understand why the change was necessary.
AI Debugging Workflow at a Glance
Reproduce → Collect evidence → Investigate → Test hypothesis → Fix → Regression test → Review
This sequence keeps AI assistance connected to actual application behavior instead of relying on guesses.
Practical Examples: Debugging with AI
The following examples show how AI can assist with common programming problems. They also illustrate why a technically valid code change is not always the correct business solution.
Example 1: Fixing a JavaScript undefined or null error
Consider the following JavaScript function:
function getCustomerName(customer) {
  return customer.profile.name;
}
console.log(getCustomerName({ profile: null }));
The function throws an error because it attempts to access the name property of a null value.
An AI assistant might suggest:
function getCustomerName(customer) {
  return customer?.profile?.name ?? "Unknown customer";
}
This prevents the exception when the customer or profile is missing. However, it is not automatically the correct business solution.
If a missing profile indicates corrupted data or an incomplete registration, silently returning a fallback name could hide an important problem.
A better debugging process establishes whether missing profiles are expected, defines the required behavior, and adds tests for valid customers, missing profiles, and invalid input.
Example 2: Investigating a database query failure
Suppose an application begins returning database errors after a Prisma schema change.
Instead of immediately regenerating the client or modifying the database, ask AI to compare the relevant query, Prisma schema, migration history, and exact error output.
The investigation should establish whether the issue comes from:
- A field that does not exist in the current schema.
- An unapplied database migration.
- A generated client that does not match the schema.
- An incorrect import or build configuration.
- An application connected to an unexpected database.
Once the cause is confirmed, apply the appropriate correction and verify it against a development or test database. Avoid using destructive production migrations as a debugging experiment.
Example 3: Debugging a failed API request
Suppose a frontend request returns HTTP 500 after a user submits a form.
The status indicates that the server encountered an error, but it does not identify the root cause.
Give AI the request path, sanitized server logs, relevant API handler, expected response, and actual response. Ask it to trace the execution path and identify the evidence needed to distinguish between a validation failure, database issue, and external service error.
After correcting the cause, test both successful and unsuccessful requests. Confirm that the endpoint returns appropriate HTTP status codes and does not expose internal stack traces or confidential information to users.
Example 4: Investigating a failed frontend build
Imagine a React or Next.js application that fails during a production build after a component has been updated.
A useful AI-assisted investigation would include the complete build output, the updated component, relevant TypeScript interfaces, and any recent dependency changes.
The assistant can help identify whether the failure relates to an invalid import, incompatible type, missing generated file, incorrect server/client component boundary, or environment configuration.
The developer should then test the specific explanation rather than immediately rewriting the component or changing several dependencies.
Best AI Debugging Tools for Developers in 2026
Several AI development tools can assist with debugging, but their capabilities and workflows differ. Some provide conversational coding assistance, while others can inspect repositories, edit files, execute tests, and work through multi-step tasks.
The following tools are worth evaluating based on your development environment and requirements.
1. OpenAI Codex
Best for: Developers exploring AI agents for code investigation and software engineering tasks.
OpenAI Codex is a coding agent that can help developers work through software tasks in supported environments. It can assist with understanding code, investigating bugs, implementing changes, and reviewing development work.
For debugging, a developer can provide a clearly defined issue and ask the agent to inspect the relevant code, identify possible causes, propose a minimal correction, and report which checks were performed.
What to consider: The actual result depends on repository context, task clarity, available tools, and permissions. Review file changes and test results before accepting a proposed solution.
2. GitHub Copilot
Best for: Developers who want AI debugging assistance inside their existing IDE.
GitHub Copilot provides coding assistance in supported development environments. Developers can use it to explain code, interpret errors, generate tests, and investigate implementation problems.
Its integration with existing editor workflows makes it useful for developers who do not want to move to an entirely different development environment.
What to consider: Check the context available to the assistant and review its suggestions against the actual project implementation.
3. Cursor
Best for: Developers debugging larger projects with multiple connected files.
Cursor is an AI-focused code editor that provides codebase-aware assistance and multi-file development workflows.
It can be useful when a bug requires tracing relationships between frontend components, API handlers, database models, and tests.
What to consider: Multi-file changes should be reviewed carefully. Check the final diff and run relevant tests before accepting modifications.
4. Claude Code
Best for: Developers who prefer terminal-based, repository-aware debugging.
Claude Code is an agentic coding tool that can work with project files and development commands within its granted permissions.
It can assist with investigating errors, exploring unfamiliar code, implementing corrections, and running relevant tests.
What to consider: Review command permissions and avoid allowing unrestricted access to sensitive systems or production resources.
5. Gemini Code Assist
Best for: Developers working with Google technologies and supported development environments.
Gemini Code Assist offers AI coding assistance that can help developers understand code, investigate programming problems, and work with supported Google development environments.
What to consider: Check the features, account requirements, and data-handling terms of the specific offering you intend to use.
Traditional debugging tools still matter
AI coding assistants work best when their suggestions can be checked against reliable engineering tools.
- Browser developer tools: Inspect network requests, JavaScript exceptions, and frontend behavior.
- Debuggers and breakpoints: Pause execution and inspect actual variable values.
- Automated tests: Reproduce known defects and protect expected behavior.
- Logs and distributed traces: Understand how requests move through different services.
- Type checkers and linters: Detect certain classes of errors before runtime.
- Version control: Compare changes and identify when a regression was introduced.
AI can help interpret the evidence these tools produce, but it cannot replace the evidence itself.
For more comparisons, see our guide to AI developer tools in 2026.
How to Write Effective AI Debugging Prompts
The quality of an AI debugging response depends partly on the information supplied. Vague instructions often produce generic explanations or speculative fixes.
A useful debugging prompt should define the problem, expected behavior, actual behavior, available evidence, and constraints.
Reusable AI debugging prompt for developers
You can adapt the following prompt for ChatGPT, GitHub Copilot, Cursor, Claude Code, or another AI coding assistant:
You are helping me debug an existing software project.
PROBLEM:
[Describe the observed failure.]
EXPECTED BEHAVIOR:
[Explain what should happen.]
ACTUAL BEHAVIOR:
[Explain what happens instead.]
ERROR OUTPUT:
[Paste the relevant sanitized error message or stack trace.]
RELEVANT CODE:
[Include the smallest useful code section or identify the
files available in the repository.]
RECENT CHANGES:
[Describe recent modifications that may be related.]
CONSTRAINTS:
- Inspect the existing implementation before suggesting edits.
- Do not invent missing requirements.
- Identify the likely causes and the evidence supporting each.
- Separate confirmed facts from assumptions.
- Recommend the smallest useful diagnostic test.
- Do not modify unrelated files.
- Do not request or expose production secrets.
VERIFICATION:
- Explain how to reproduce the failure.
- Suggest a regression test where appropriate.
- Run relevant checks if the environment permits.
- Report the actual commands and results.
- Identify remaining risks or uncertainty.
Begin with diagnosis. Do not modify files until the
likely cause and proposed correction have been explained.
Why this debugging prompt works
The prompt separates diagnosis from implementation. This matters because asking an AI assistant to immediately fix an error can encourage it to make assumptions before understanding the problem.
It also asks the assistant to distinguish confirmed information from assumptions and to propose a diagnostic test. This makes it easier for the developer to evaluate the answer instead of blindly accepting a plausible explanation.
For coding agents with access to files or terminal commands, include explicit permission boundaries. Require approval before destructive operations, production changes, database modifications, or actions involving sensitive systems.
For additional guidance, read the OpenAI Prompt Engineering Guide. Its general principles around clear instructions, relevant context, constraints, and structured outputs are useful when designing prompts for software development.
Common Mistakes and Security Risks When Debugging with AI
AI debugging can improve development workflows, but careless use can introduce technical debt, expose sensitive information, or create additional software defects.
1. Accepting the first explanation
AI may confidently identify the wrong cause. A convincing explanation is not proof that the diagnosis is correct.
Test the proposed explanation against the logs, source code, and runtime behavior before changing the application.
2. Applying a large patch to fix a small bug
Broad changes increase the number of possible regressions and make it harder to determine what actually resolved the problem.
Prefer a focused correction. Handle unrelated refactoring as a separate task.
3. Sharing sensitive logs or source code
Error reports may contain API keys, access tokens, customer information, internal URLs, database identifiers, and other confidential information.
Sanitize the information before sharing it and follow your organization’s approved AI-tool and data-handling policies.
4. Allowing an agent to execute unsafe commands
Some coding agents can access project files, install packages, execute terminal commands, and modify application code.
Review commands that could delete data, expose secrets, change permissions, or modify infrastructure. Use isolated development environments and least-privilege access wherever possible.
5. Fixing symptoms instead of root causes
Suppressing an exception, adding a broad fallback, or disabling a failing test can make a problem disappear from view without correcting the defect.
Confirm that the change restores the intended application behavior rather than simply hiding the error.
6. Ignoring dependency and supply-chain risks
AI-generated suggestions may introduce unnecessary packages or recommend unfamiliar dependencies.
Check package names, maintainers, provenance, permissions, maintenance status, and known vulnerabilities before adding a dependency to a project.
7. Exposing systems through excessive agent permissions
An AI coding agent should not automatically have unrestricted access to production databases, cloud credentials, payment systems, or deployment environments.
Use separate development credentials, limited permissions, approval steps, and appropriate audit controls. Treat repository instructions and external content as untrusted until reviewed, particularly when an agent can execute commands.
For more information, read our guide to AI agent security risks and the OWASP Top 10 for Large Language Model Applications.
Best Practices for Reliable AI Debugging
To get consistent results from AI debugging tools, developers should establish a process that prioritizes evidence, controlled changes, and verification.
- Reproduce the bug first: Establish a repeatable failure before changing code.
- Provide focused context: Share relevant files and error output instead of overwhelming the assistant with unrelated information.
- Ask for hypotheses: Encourage the assistant to identify alternative causes and explain how to test them.
- Change one thing at a time: Make it easier to identify which modification affected the outcome.
- Preserve a known-good state: Use version control and appropriate backups before risky changes.
- Automate regression checks: Convert confirmed defects into repeatable tests where practical.
- Review the diff: Confirm that the patch is focused, understandable, and relevant.
- Protect sensitive information: Sanitize logs and restrict AI-tool permissions.
- Verify the final result: Run relevant tests, builds, and application checks.
- Document the root cause: Record what failed, why it failed, and how the correction was verified.
How to Measure Whether AI Debugging Actually Helps
It is easy to assume that an AI tool improves productivity because it generates code quickly. A better evaluation examines whether it helps developers resolve defects accurately and with less unnecessary rework.
Development teams can compare their debugging process before and after introducing an AI tool using practical measurements.
| Measurement | What it tells you |
|---|---|
| Time to reproduce | How quickly developers can recreate a reported problem. |
| Time to identify root cause | How long it takes to establish why the defect occurred. |
| Fix acceptance rate | How often proposed corrections pass review and verification. |
| Regression rate | Whether fixes introduce new defects or cause old problems to return. |
| Rework required | How much additional work is needed to correct AI-generated suggestions. |
| Test coverage of the defect | Whether the original failure is protected by an appropriate regression test. |
For a meaningful comparison, use similar categories of bugs and account for their complexity. A simple syntax error should not be compared directly with a distributed systems failure.
The objective is not to maximize the amount of code generated by AI. It is to improve the quality and efficiency of the debugging process.
The Future of Debugging with AI
AI debugging is moving beyond conversational explanations and isolated code suggestions. Modern coding agents can increasingly work across project files, use development tools, execute tests, and assist with connected engineering tasks.
More automated investigation
AI agents can help trace errors across related components and organize possible causes into a structured investigation. Developers may increasingly delegate repetitive diagnostic work while retaining control over implementation and approval.
Better integration with development environments
AI features are becoming more closely integrated with code editors, source control platforms, test runners, monitoring systems, and cloud development environments.
This creates opportunities for more connected workflows, provided that access controls and verification processes are properly designed.
More emphasis on software quality and security
As AI tools generate and modify more code, testing, security review, dependency management, and code governance become increasingly important.
Developers will need to understand not only how to use AI to generate a correction but also how to determine whether that correction is safe and maintainable.
Developers will need stronger engineering judgement
AI can help with routine investigation, but software engineers remain responsible for understanding system behavior, architectural trade-offs, business requirements, and operational risks.
Developers who can combine AI assistance with strong debugging fundamentals will be better positioned to work effectively with increasingly capable coding tools.
Explore our guide to the human and AI programming workflow to understand how developers can combine automation with engineering judgement.
Conclusion: Is Debugging with AI Worth It?
Debugging with AI can help developers investigate errors, understand unfamiliar code, identify possible root causes, generate targeted fixes, and create regression tests. Its greatest value comes from reducing the time spent exploring possible explanations while keeping the investigation grounded in evidence.
The reliable approach is straightforward: reproduce the problem, collect relevant context, ask AI to investigate, test the leading hypothesis, apply a focused correction, and verify the result.
AI can suggest what might be wrong. Logs, tests, controlled experiments, and engineering judgement establish whether that suggestion is correct.
When these elements work together, debugging becomes more systematic, efficient, and maintainable.
For more practical resources, explore our AI developer tools guide and other software engineering articles on Techtrep.
Frequently Asked Questions
1. What is debugging with AI?
Debugging with AI means using artificial intelligence tools to help interpret errors, explore source code, identify possible causes, suggest fixes, and generate tests. Developers still need to verify the diagnosis and ensure the correction works as expected.
2. Can AI automatically fix software bugs?
Some AI coding tools can propose and apply code changes, run tests, and iterate on failures. However, they can misunderstand requirements or introduce regressions. Human review and appropriate automated checks remain important.
3. What is the best AI tool for debugging code?
The best tool depends on your programming language, editor, repository, and workflow. Developers can evaluate OpenAI Codex, GitHub Copilot, Cursor, Claude Code, and Gemini Code Assist based on their ability to understand code, interpret errors, support testing, respect permissions, and protect sensitive information.
4. Can AI debug JavaScript and TypeScript errors?
Yes. AI can help interpret JavaScript exceptions, TypeScript type errors, build failures, and browser console messages. Provide the relevant code and exact error output, then verify proposed changes with tests and a build.
5. Is AI debugging reliable for production systems?
AI can assist with production incident investigation, but its suggestions should be treated as hypotheses. Sanitize logs, protect customer data, restrict tool access, verify the root cause, and follow your incident-management and change-control procedures.
6. How do I stop AI from introducing new bugs while fixing old ones?
Keep changes narrowly scoped, review the diff, add regression tests, run the existing test suite, and check relevant security and integration behavior. For high-impact changes, require independent review and staging validation.
7. Can AI help debug database and API errors?
Yes. AI can help trace requests, inspect query logic, interpret sanitized logs, and suggest diagnostic tests. Confirm the diagnosis using the actual database schema, API responses, application configuration, and runtime evidence.
8. Is debugging with AI suitable for beginners?
Yes. Beginners can use AI tools to understand error messages, learn debugging concepts, and explore unfamiliar code. They should still learn how to use debuggers, read logs, write tests, and understand the code rather than relying entirely on generated solutions.
9. Should developers trust AI-generated debugging solutions?
Developers should evaluate AI-generated solutions rather than trust them automatically. Check the diagnosis against the source code, reproduce the original problem, review the proposed changes, and run tests to confirm that the correction works.

Leave a reply